
See–Think–Wonder with Phyphox: Turning Observations into Science
Published:
An activity to get you started with research using your smartphone.
Introduction
Science often begins with curiosity — noticing something, wondering why it happens, and finding a way to test it.
In this post, we’ll take the See–Think–Wonder framework and pair it with the Phyphox smartphone app to turn everyday observations into real, measurable experiments.
Step 1 – See
Pick something around you that can be measured by your phone’s sensors.
Some ideas:
- Motion: Elevator rides, swings, escalators (Accelerometer).
- Sound: Classroom noise, hallway echoes (Sound amplitude).
- Magnetic fields: Near chargers, laptops, or whiteboards (Magnetometer).
- Light: Brightness near windows at different times of day (Light sensor).
Write down exactly what you see — no guesses yet.
Step 2 – Think
Now, make a prediction (your hypothesis) about what’s happening and why.
Example:
I think the light intensity will be lower near the window in the morning than in the afternoon.
Step 3 – Wonder
Turn your observation into a measurable question.
Example:
I wonder how much the magnetic field changes when I move my phone from the classroom table to near a laptop charger.
Step 4 – Collect Data with Phyphox
- Install Phyphox on your phone.
- Open the app and choose the relevant experiment:
- Accelerometer for motion/tilt.
- Sound amplitude for noise levels.
- Magnetometer for magnetic fields.
- Light for brightness changes.
- Record your data during the activity.
- Export it as CSV for deeper analysis in Excel, Python, or Google Sheets.
Step 5 – Analyse and Conclude
- Check for patterns or spikes in your recorded graphs.
- Compare your findings to your “Think” prediction.
- Ask yourself: Did the data confirm your idea or reveal something new?
Example Classroom Activity – Sound
Observation (See): It’s noisy during lunch breaks.
Prediction (Think): Noise will peak right when the bell rings.
Question (Wonder): How quickly does the sound level drop after lunch break begins?
Method:
- In Phyphox, select Sound amplitude.
- Start recording 30 seconds before the bell.
- Stop recording after 2 minutes.
Example Result Graph:
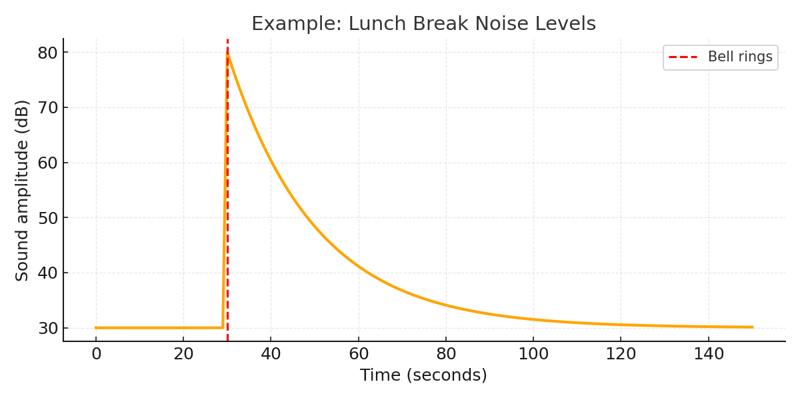
This graph shows a stable noise baseline before the bell, a sharp peak at the bell, and a gradual decay afterward.
Additional Example – Light Sensor
Observation (See): The brightness changes throughout the school day.
Prediction (Think): Light intensity will peak at noon when the sun is highest.
Question (Wonder): What is the pattern of light intensity from morning to evening?
Example Result Graph:
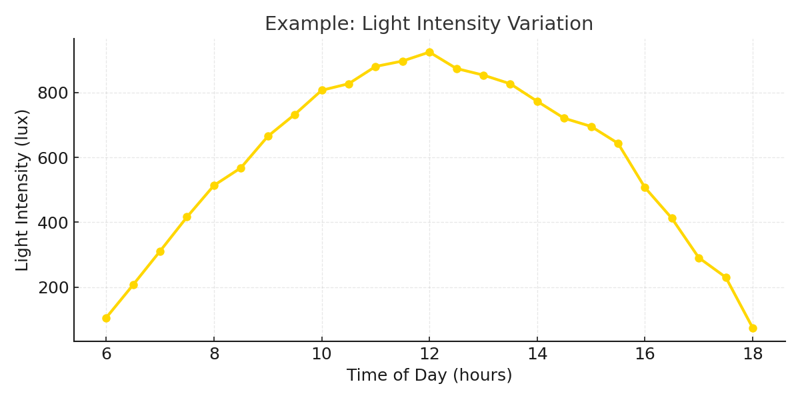
The graph shows a clear midday peak in brightness, matching the prediction.
Additional Example – Magnetometer
Observation (See): Electronic devices seem to affect my phone’s compass.
Prediction (Think): Magnetic field readings will be highest near power adapters.
Question (Wonder): How much does the magnetic field strength vary at different spots in the classroom?
Example Result Graph:
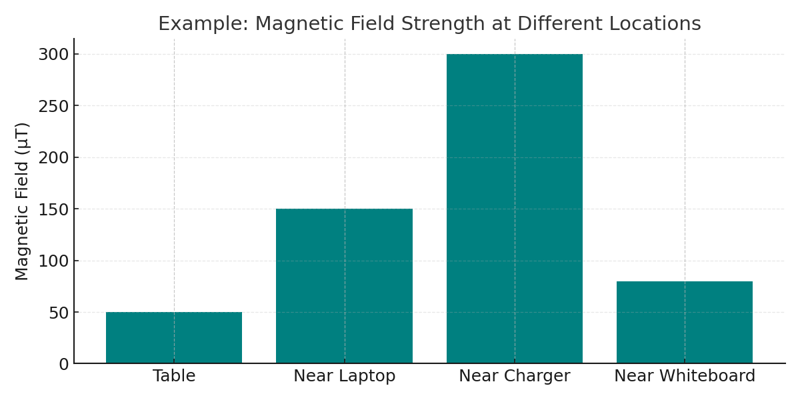
The bar chart shows strong magnetic fields near laptops and chargers.
Worksheet
| Step | Notes |
|---|---|
| See | What did you observe? |
| Think | What do you think is happening and why? |
| Wonder | What question can you ask that can be measured with Phyphox? |
| Experiment Setup | Which Phyphox tool will you use? How will you record data? |
| Results | What does your data show? |
| Conclusion | Did your data match your prediction? What did you learn? |
Final Thoughts
By pairing See–Think–Wonder with Phyphox, you can move from curiosity to evidence-based conclusions. It’s a simple way to make science hands-on, data-driven, and fun — right from your smartphone. A stepping stone to research methodology.
For more experiment ideas, visit the official Phyphox Experiments Library.